The correlation ρ(Y, Z) = σ(Y, Z) / (σ_Y σ_Z) is the unitless covariance of two random variables; it lies in [−1, 1], and the variables are uncorrelated if it is zero.
Extreme values:∣ρ∣=1 iff Z is an affine function of Y (with probability one); the sign is the sign of the slope.
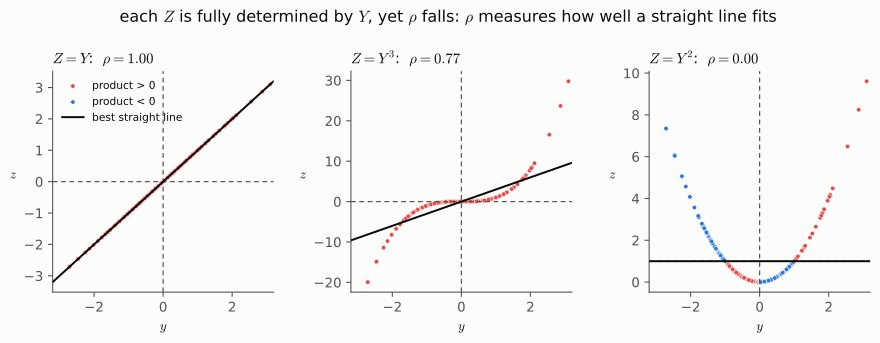
Independence ⇒ uncorrelated, not conversely:independent variables have σ(Y,Z)=0, hence ρ=0. Uncorrelated variables can still be dependent (example below). Correlation only measures linear dependence.
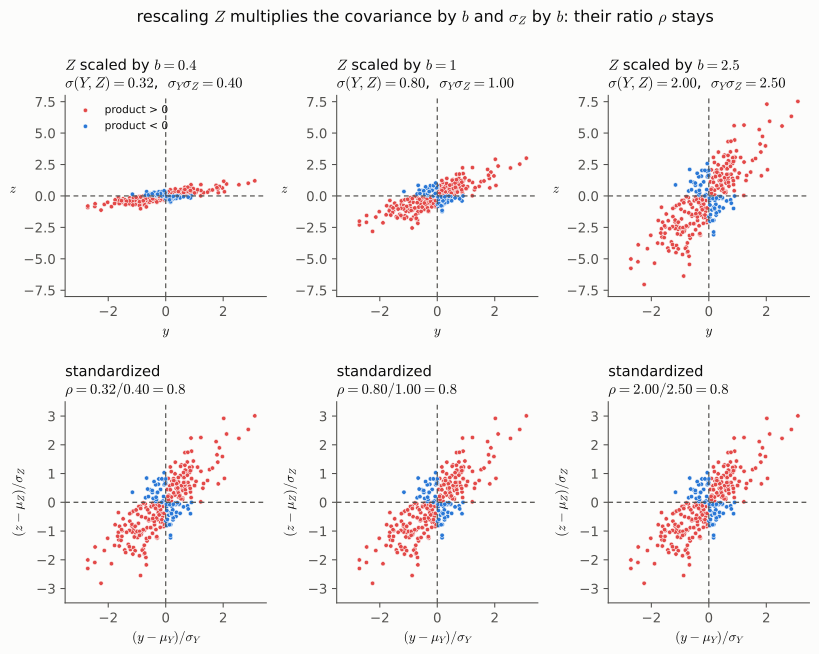
Correlation is covariance with the scale removed. Multiplying Z by b>0 (e.g. switching from meters to centimeters) multiplies every offset product (y−μY)(z−μZ), and with it σ(Y,Z), by b (top row). The standard deviationσZ grows by the same factor b, so dividing by σYσZ cancels the scaling exactly. Equivalently, ρ(Y,Z)=E{σYY−μY⋅σZZ−μZ} is the covariance of the standardized variables: rescale each axis to spread 1, then weight the quadrants as for the covariance (bottom row, three times the same cloud).
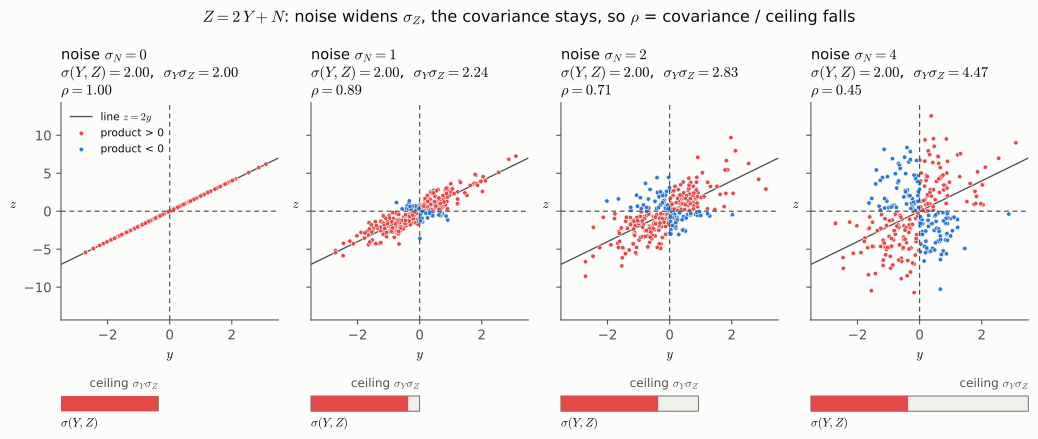
σYσZ is also the ceiling of the covariance: ∣σ(Y,Z)∣≤σYσZ, with equality only if the points lie exactly on a line (Z=cY gives σ(Y,Z)=cσY2=σYσZ). So ρ is the share of the ceiling that the covariance reaches (bars below the panels). Adding independent noise N to Z=2Y+N leaves the covariance at 2σY2, but widens σZ=4σY2+σN2, so ρ falls. On a line ρ=±1 whatever the slope: the slope is in the covariance, not in ρ.
ρ measures how well the best straight line fits the cloud, not how strongly Z depends on Y. In all three panels Z is fully determined by Y∼N(0,1) (Normal Distribution), yet ρ falls from the line (ρ=1) over the monotone curve Z=Y3 (ρ=3/15≈0.77, from E{Y4}=3, E{Y6}=15) to the symmetric parabola Z=Y2 (ρ=0, uncorrelated but dependent).